BJP has increased the number of its MLAs from 773 to 1798 from 2013 to 2026. It has registered a big lead in West Bengal with 190+ MLAs, while the party also has a strong base in Uttar Pradesh and Madhya Pradesh.
MLA Count BJP 2013 vs 2026: Bharatiya Janata Party (BJP) is moving towards a big victory in the West Bengal Assembly elections 2026. With this victory, BJP is going to create a new history. BJP is coming to power for the first time in West Bengal. Along with this, BJP government is also going to be formed in Assam and Puducherry. Let us tell you that under the leadership of Prime Minister Narendra Modi, BJP has expanded rapidly in the entire country. Even in the last 13 years, the number of BJP MLAs across the country has more than doubled.
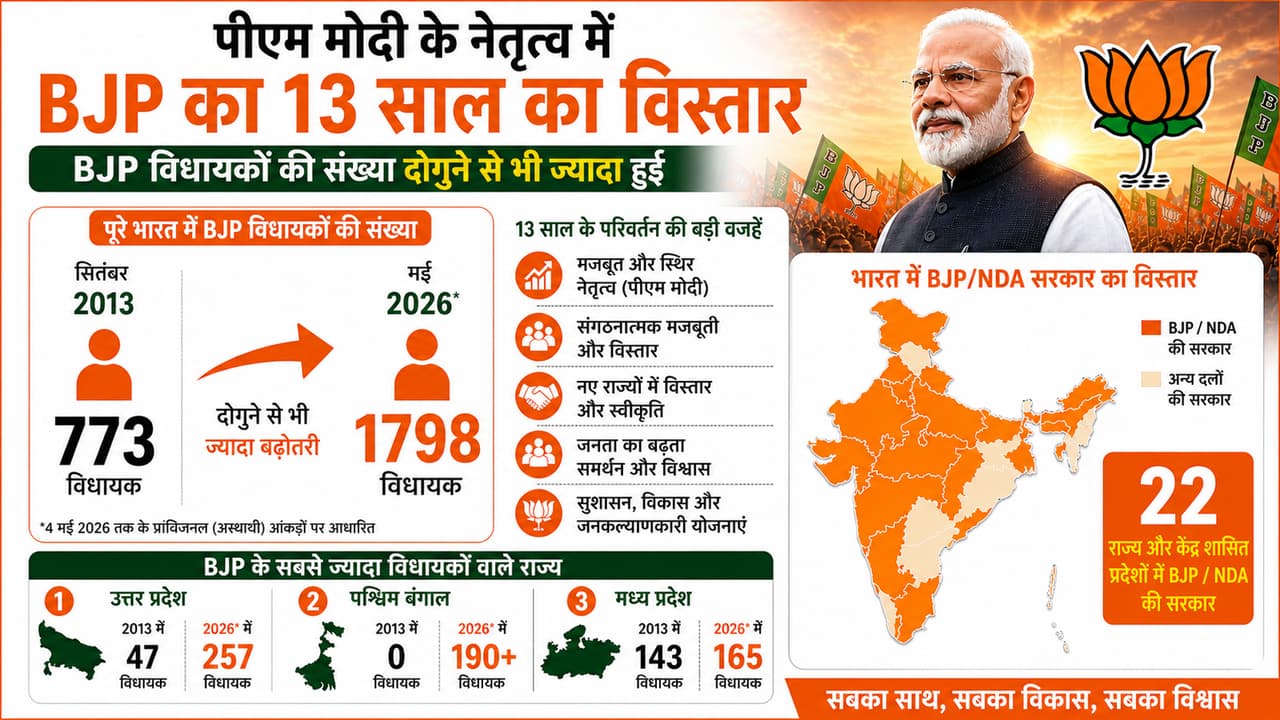
Journey from 773 to 1798 MLAs
Ever since PM Modi has emerged as a central force in national politics, the number of BJP MLAs across the country has increased more than 2 times. While there were 773 MLAs in September 2013, now this number has increased to 1798 in May 2026. BJP’s influence at the national level continues to grow with a possible victory in West Bengal and expansion into other states. The sharp increase in the number of MLAs and the ability to form governments in new states shows that the party has become a strong and expanding force in the country’s politics.
Top-3 states with maximum number of BJP MLAs
If we talk about the state with the highest number of BJP MLAs, after its victory, West Bengal will be at second position. According to the provisional data of May 4, BJP may now have 190+ MLAs in West Bengal, which was zero in 2013. Uttar Pradesh is on top with 257 MLAs. In 2013, BJP had only 47 MLAs in UP. At the same time, Madhya Pradesh is at third place, where BJP now has 165 MLAs. Whereas, in September 2013 this figure was 143.
How many MLAs does BJP have in all the states across the country?
| assembly seat | September 2013 figures | Figures for May, 2026 |
| Andhra Pradesh | 2 | 8 |
| Arunachal Pradesh | 3 | 46 |
| Assam | 5 | 82* |
| Bihar | 91 | 89 |
| Chhattisgarh | 50 | 54 |
| Delhi | 23 | 48 |
| Goa | 21 | 27 |
| Gujarat | 115 | 161 |
| Haryana | 4 | 48 |
| Himachal Pradesh | 26 | 25 |
| Jammu and Kashmir | 11 | 29 |
| Jharkhand | 18 | 21 |
| Karnataka | 40 | 64 |
| Keralam | 0 | 3* |
| Madhya Pradesh | 143 | 165 |
| Maharashtra | 46 | 131 |
| Manipur | 0 | 36 |
| Meghalaya | 0 | 2 |
| Mizoram | 0 | 2 |
| Nagaland | 1 | 11 |
| Odisha | 6 | 79 |
| Punjab | 12 | 2 |
| Puducherry | 0 | 3* |
| Rajasthan | 78 | 118 |
| Sikkim | 0 | 0 |
| Tamil Nadu | 0 | 2* |
| Telangana | – | 7 |
| Tripura | 0 | 32 |
| Uttar Pradesh | 47 | 257 |
| Uttarakhand | 31 | 47 |
| west bengal | 0 | 199* |
| Total MLA | 773 | 1798* |
Note: (* The figures for the election states are provisional, which may change after the final results.)