Bulls seem to be in a strong stand now, taking the Nifty 50 beyond 22,500 mark, though there was a bit of bear action towards the end on March 28, the monthly F&O expiry session.
If the index manages to close above the same in the coming sessions, then there may be a strong uptrend in the April series, experts said, adding that 22,200 may be an immediate resistance, followed by 22,000.
On March 28, the Nifty 50 jumped 203 points to 22,327 and formed a bullish candlestick pattern on the daily charts, while the BSE Sensex climbed 655 points to 73,651. However, the broader markets underperformed the benchmark indices, as the Nifty Midcap 100 and Smallcap 100 indices gained half a percent and 0.04 percent.
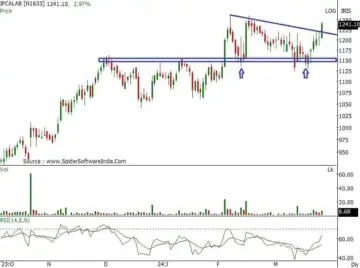
Stocks that performed better than the broader markets in the last trading session included Ipca Laboratories, Aegis Logistics, and Cholamandalam Financial Holdings. Ipca Laboratories has seen a decisive breakout of consolidation and recorded 2.66 percent gains at Rs 1,237, forming a long bullish candlestick pattern on the daily charts, with above average volumes.
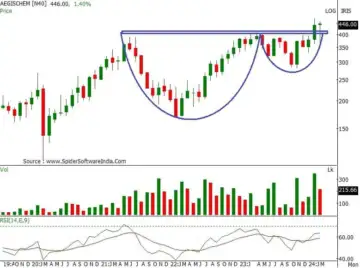
Aegis Logistics also saw a strong breakout after recent consolidation, rising 13 percent to Rs 446.65 and formed robust bullish candlestick pattern on the daily charts with significantly higher volumes. The stock traded above all key moving averages, which is a positive sign.
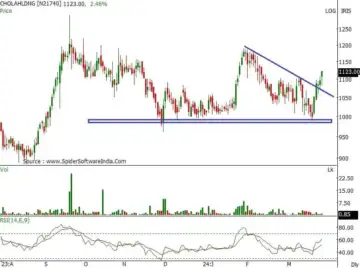
After hitting 200-day EMA (exponential moving average), Cholamandalam Financial Holdings has seen a healthy recovery and climbed above all key moving averages. The stock rose 1.4 percent to Rs 1,111.5 and formed high wave kind of candlestick pattern on the daily charts, indicating volatility after recent run up.
Here’s what Rajesh Palviya of Axis Securities recommends investors should do with these stocks when the market resumes trading today:
After a couple of month’s short term consolidation, the stock has witnessed strong breakout at Rs 1,220 level only on a closing basis. This trendline breakout is accompanied with huge volumes indicating increased participation.
The stock has recaptured 20 and 50 day SMA (simple moving average) and rebounded sharply. The daily, weekly and monthly strength indicator RSI (relative strength index) is in positive terrain which shows sustained strength. Huge volumes on this rally signifies sustained participation.
Investors should buy, hold and accumulate this stock with an expected upside of Rs 1,300-1,385, with downside support zone of Rs 1,200-1,160 levels. 
Since September 2023, the stock is in corrective mode and consolidating within Rs 1,200-9,70 levels. This consolidation is strongly supported by the 200-day SMA (Rs 1,036) which remains a crucial support zone. The daily “down-sloping” trendline breakout signifies bull’s command and resumption of prior uptrend. The daily and weekly strength indicator RSI is in positive terrain which shows rising strength on short to medium term charts.
Investors should buy, hold and accumulate this stock with an expected upside of Rs 1,200-1,285, with downside support zone of Rs 1,085-1,035 levels.

On the monthly chart, the stock has formed a “Cup & Handle” formation breakout at Rs 415 levels. Huge volumes on this breakout signifies increased participation in the rally.
With recent price correction, the stock has revisited its 100 and 200-day SMA and rebounded sharply. The daily, weekly and monthly strength indicator RSI is in positive terrain which shows sustained strength.
Investors should buy, hold and accumulate this stock with an expected upside of Rs 520-585, with downside support zone of Rs 395-385 levels.


