
Indian benchmark indices are expected to witness a volatile session, amid mixed but weak global market cues. The GIFT NIFTY futures fell over 44 points on Wednesday morning, indicating a muted start for NIFTY50 after four consecutive days of rally.
Brent crude oil futures hover near $103 per barrel on Wednesday morning, as investors and oil market participants await cues from the US mid-term elections. On the other hand, the negotiations between the US and Iran continue as no fresh agreements were made in the peace talks in Qatar.
The US stock market closed in green on Tuesday’s regular trading session ahead of the mid-term election results. However, the US stock market futures fell over 1% on Wednesday morning, indicating severe uncertainty amongst investors over the election results.
Meanwhile, the Asian stock market extended the losses on Wednesday morning as tech stocks continue to witness selling pressure. Japan’s Nikkei plunged over 3%, followed by a 2% fall in Korean KOSPI, and Hang Seng traded flat-to-negative on Wednesday.
NIFTY50 chart check
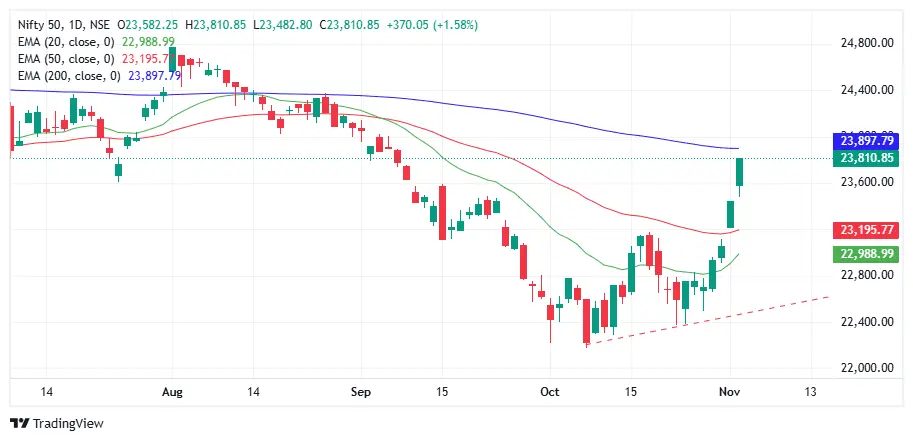
NIFTY50 extended its rally for the fourth consecutive session, surging 370 points on the weekly expiry day. The index continued its bullish momentum, with strong buying, and closed at intraday highs. However, on the hourly charts, the RSI of 83 indicates an extreme overbought scenario, meaning some retracement towards the hourly 20 EMA levels of 23,415 could be on the cards.
On the daily charts, the index has recouped more than 50% of the fall that occurred from 03rd August, indicating strong buying momentum in the index. While it trades above the daily 20 and 50 moving averages, the 200 SMA remains a crucial resistance for the index to cross. Price action on the daily charts suggests a time of consolidation or retracement towards the 23,200 to 23,400 support zone could occur before it breaches and sustains above the 200 EMA levels.
NIFTY50 open interest check
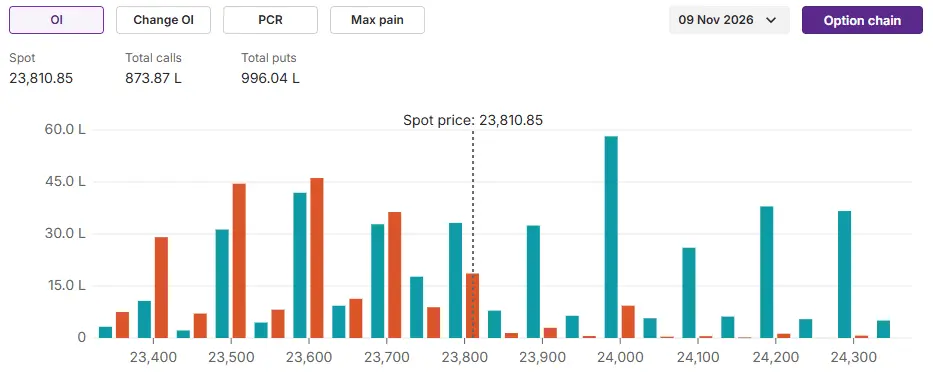 The early buildup for the coming weekly expiry on 09 November indicates a broad trading range between 23,000 and 24,000. The 23,000 puts held the highest open interest, indicating near-term support on the downside.
Similarly, the 24,000 calls held the highest open interest, indicating near-term resistance for the index. However, 23,400, 23,500, and 23,600 puts witnessed strong open interest addition, suggesting downside support at regular intervals.
To access a specially curated smart list of the most traded and active stocks, as well as the OI gainers and losers, simply log in: https://pro.upstox.com/ ➡️ F&O ➡️ Options smartlist/Futures smartlist. Disclaimer: Derivatives trading must be done only by traders who fully understand the risks associated with them and strictly apply risk mechanisms like stop losses. We do not recommend any particular stock, securities or strategies for trading. The securities quoted are exemplary and are not recommendations.