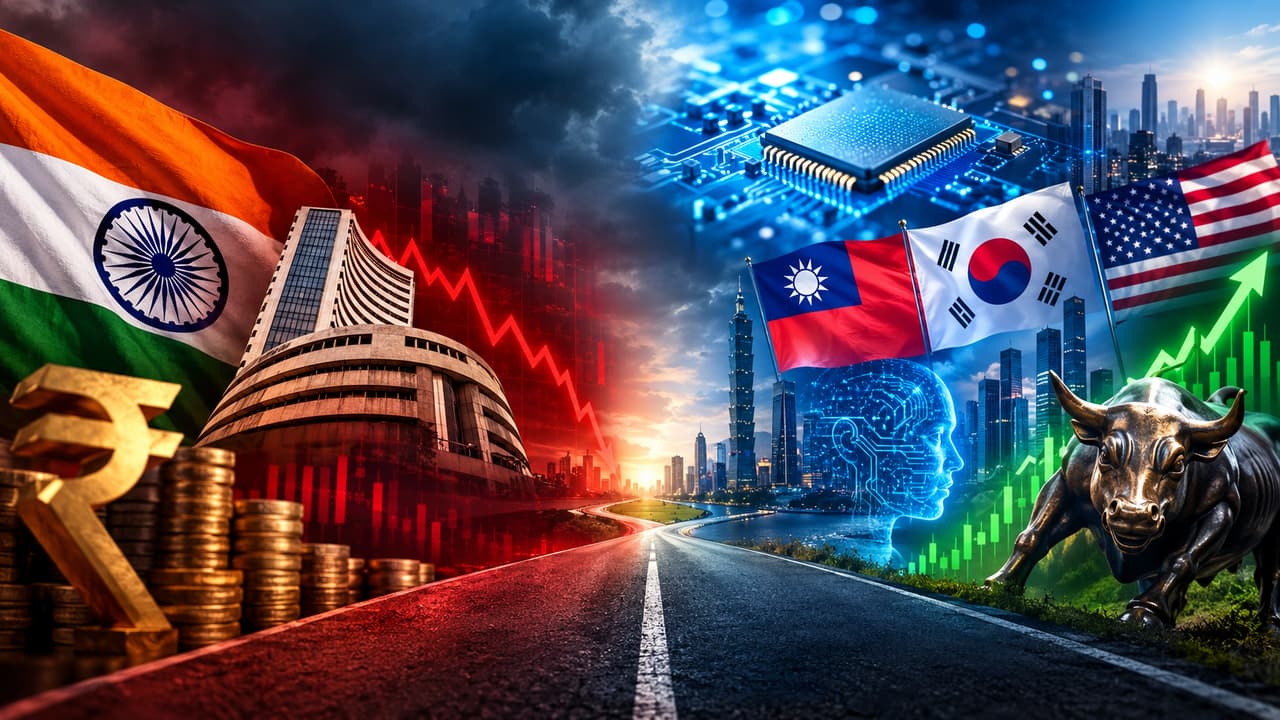
In 2026, global capital has made one concentrated bet: that machines will do more of the world’s work. The markets that build those machines have soared. India, which earns its living from people doing that work, is on the other side of the trade. Three buffers have kept the fall orderly. The AI boom is now testing all three.
After my last piece, one question came back more than any other: if foreign money is not coming to India, where is it going? The 2026 scoreboard answers it.
At Tuesday’s close, Taiwan’s TAIEX was up 66.9% this year and Korea’s KOSPI 43.2%. The Nasdaq was up 17.1% and the S&P 500 14.0%, both near records. The Nifty 50 was down 13.0%, or 18.1% in dollars. India is the only one of the five in the red, and the only one with almost no stake in AI. That is no coincidence. Nor is it the whole story.
Chart sources: Nifty: Kotak Neo • KOSPI: Korea JoongAng Daily • KOSPI peak: Herald Business • TAIEX: Taipei Times • US: TheStreet • Rupee: ThePrint • Paytm Money

THE ARGUMENT AT A GLANCE
- What the indices own. Chipmakers are over 40% of Taiwan’s index and were over half of Korea’s at its peak. The Nifty owns banks, energy and consumption.
- Where the money went. A record ₹3.04 lakh crore of foreign money has left Indian equities this year, nearly double 2025’s outflow.
- Why it stays away. Big Tech’s AI borrowing is helping keep US yields above 5%, and India’s taxes take a bigger cut than its neighbours’.
- What holds India up. Household savings, RBI reserves and services exports.
- The risk. All three are being drawn down at once, and the third is the work AI is built to automate.
THE DIVIDE: WHAT THE SCOREBOARD SHOWS & WHY
THE SCOREBOARD
The pain is real, and recent
- Ten months, 13%. The Nifty hit a record in the first days of January. By 13 October it was 13.0% lower, having closed at 22,232 on 8 October, its lowest since April 2025.
- Worse in dollars. The rupee has slid from 89.87 to 95.36 per dollar, leaving dollar investors down about 18%. Bank of America’s August count put India last of nine major markets.
- A first loss for many. Equity funds now hold 18.73 crore folios, nearly 30% of them in small- and mid-cap funds. Many arrived in the post-pandemic rally; this is their first real drawdown.
WHAT THE INDICES OWN
Why the AI rally bypassed Dalal Street
An index is a basket; its return is the weighted sum of what it holds. In 2026, the scarcest product in the world has been computing power. Profits followed scarcity, prices followed profits, and each index followed its weights.
- The scarcity sits in Asia’s fabs. TSMC makes most of the world’s advanced AI chips; Samsung and SK hynix make the memory beside them. SK hynix’s revenue rose 257% in April–June.
- Those companies are the index. TSMC alone is over 40% of the TAIEX. At the KOSPI’s peak, Samsung and SK hynix were more than half of Korea’s index.
- India owns something else. Financials are 37.5% of the Nifty. Its 7.5% technology slice is IT services, which AI threatens rather than enriches. India’s few AI suppliers, such as Sterlite Technologies, are too small to move the index.
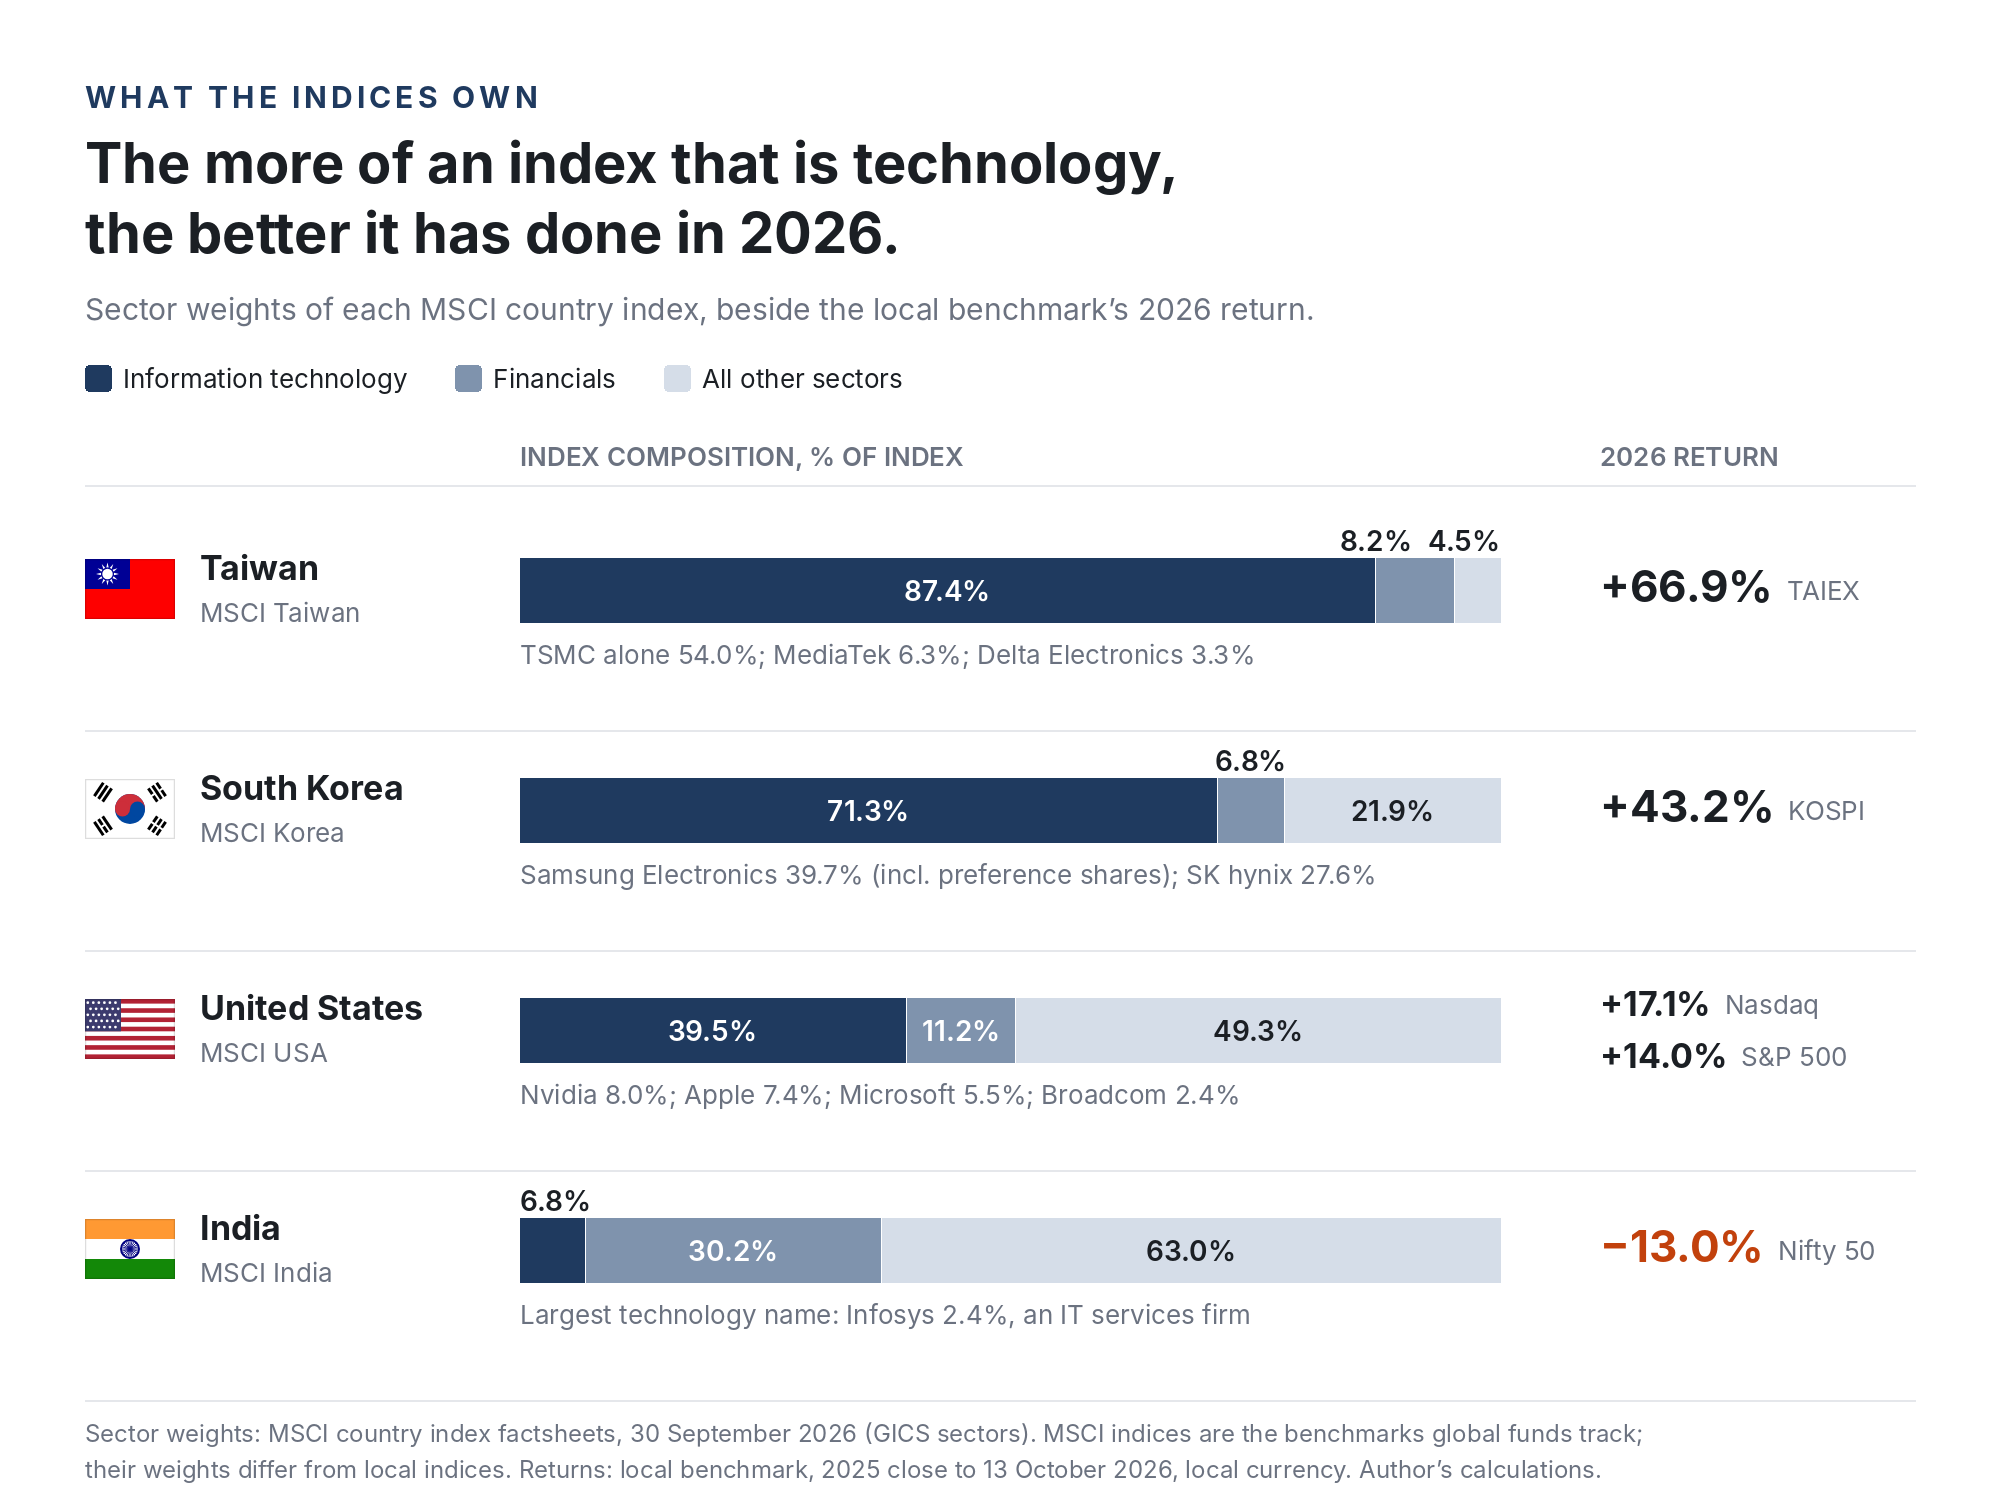
Chart sources: MSCI Taiwan • MSCI Korea • MSCI USA • MSCI India
- Passive money amplifies it. As Taiwan and Korea rose, so did their weight in the MSCI Emerging Markets index. India’s fell from almost 21% in 2024 to about 12%, so index funds must sell India to buy Seoul and Taipei. State Street calls it “a clear reallocation of capital toward markets with more direct exposure to the AI-driven semiconductor cycle.”
- Necessary, not sufficient. AI explains why India lagged, not why it fell; Taiwan and Korea faced the same oil shock and still rose. The fall comes from what follows: dearer dollar money, a tax regime that can tax a loss, and a rupee under strain.
THE BOTTOM LINE
Global capital has not turned against India. It has bought what India’s benchmark does not own.
THE PULL: THE FORCES DRAWING CAPITAL AWAY FROM INDIA
THE SHOVEL SELLERS
Who is actually earning from AI
The weights would matter less if the profits were thin. They are not. Korea’s September exports hit a record $120.9 billion, up 83.5%, half of it chips; Taiwan’s rose 60.9%. DBS expects Asia ex-Japan earnings to grow 76.3% this year against 7.4% for India, yet India trades at 21.1 times forward earnings against 11.7 for the region.
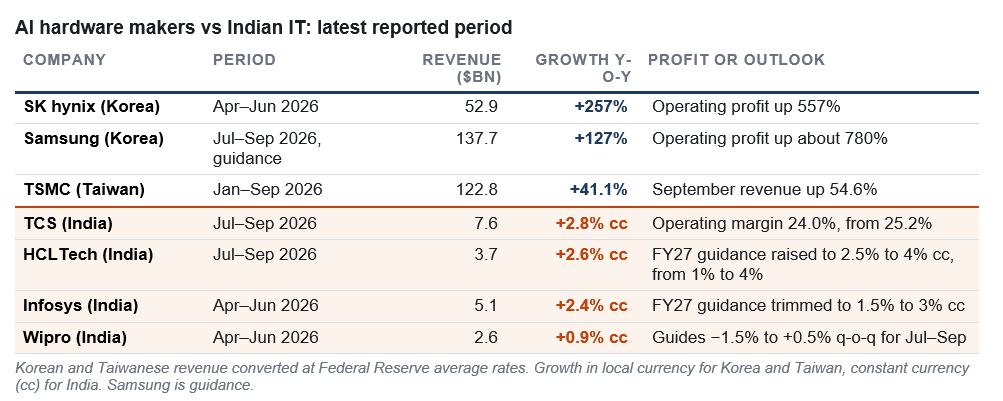
- Even the winners wobble. On 13 October, the KOSPI fell 5.5% as foreigners sold 4.51 trillion won of shares, leaving it 34% below its June record. The AI trade is no longer one-way, but the money leaving it has not come to India.
THE BOTTOM LINE
Taiwan and Korea sell the shovels of the AI boom. India sells the skills it is learning to replace.
THE BORROWED BOOM
How Silicon Valley’s debt reaches Dalal Street
Big Tech can no longer fund AI from its own cash. Capex now takes about 80% of operating cash flow at Alphabet, Amazon and Microsoft, up from 42% in 2023, and Amazon and Oracle already spend more than they generate. Debt fills the gap.
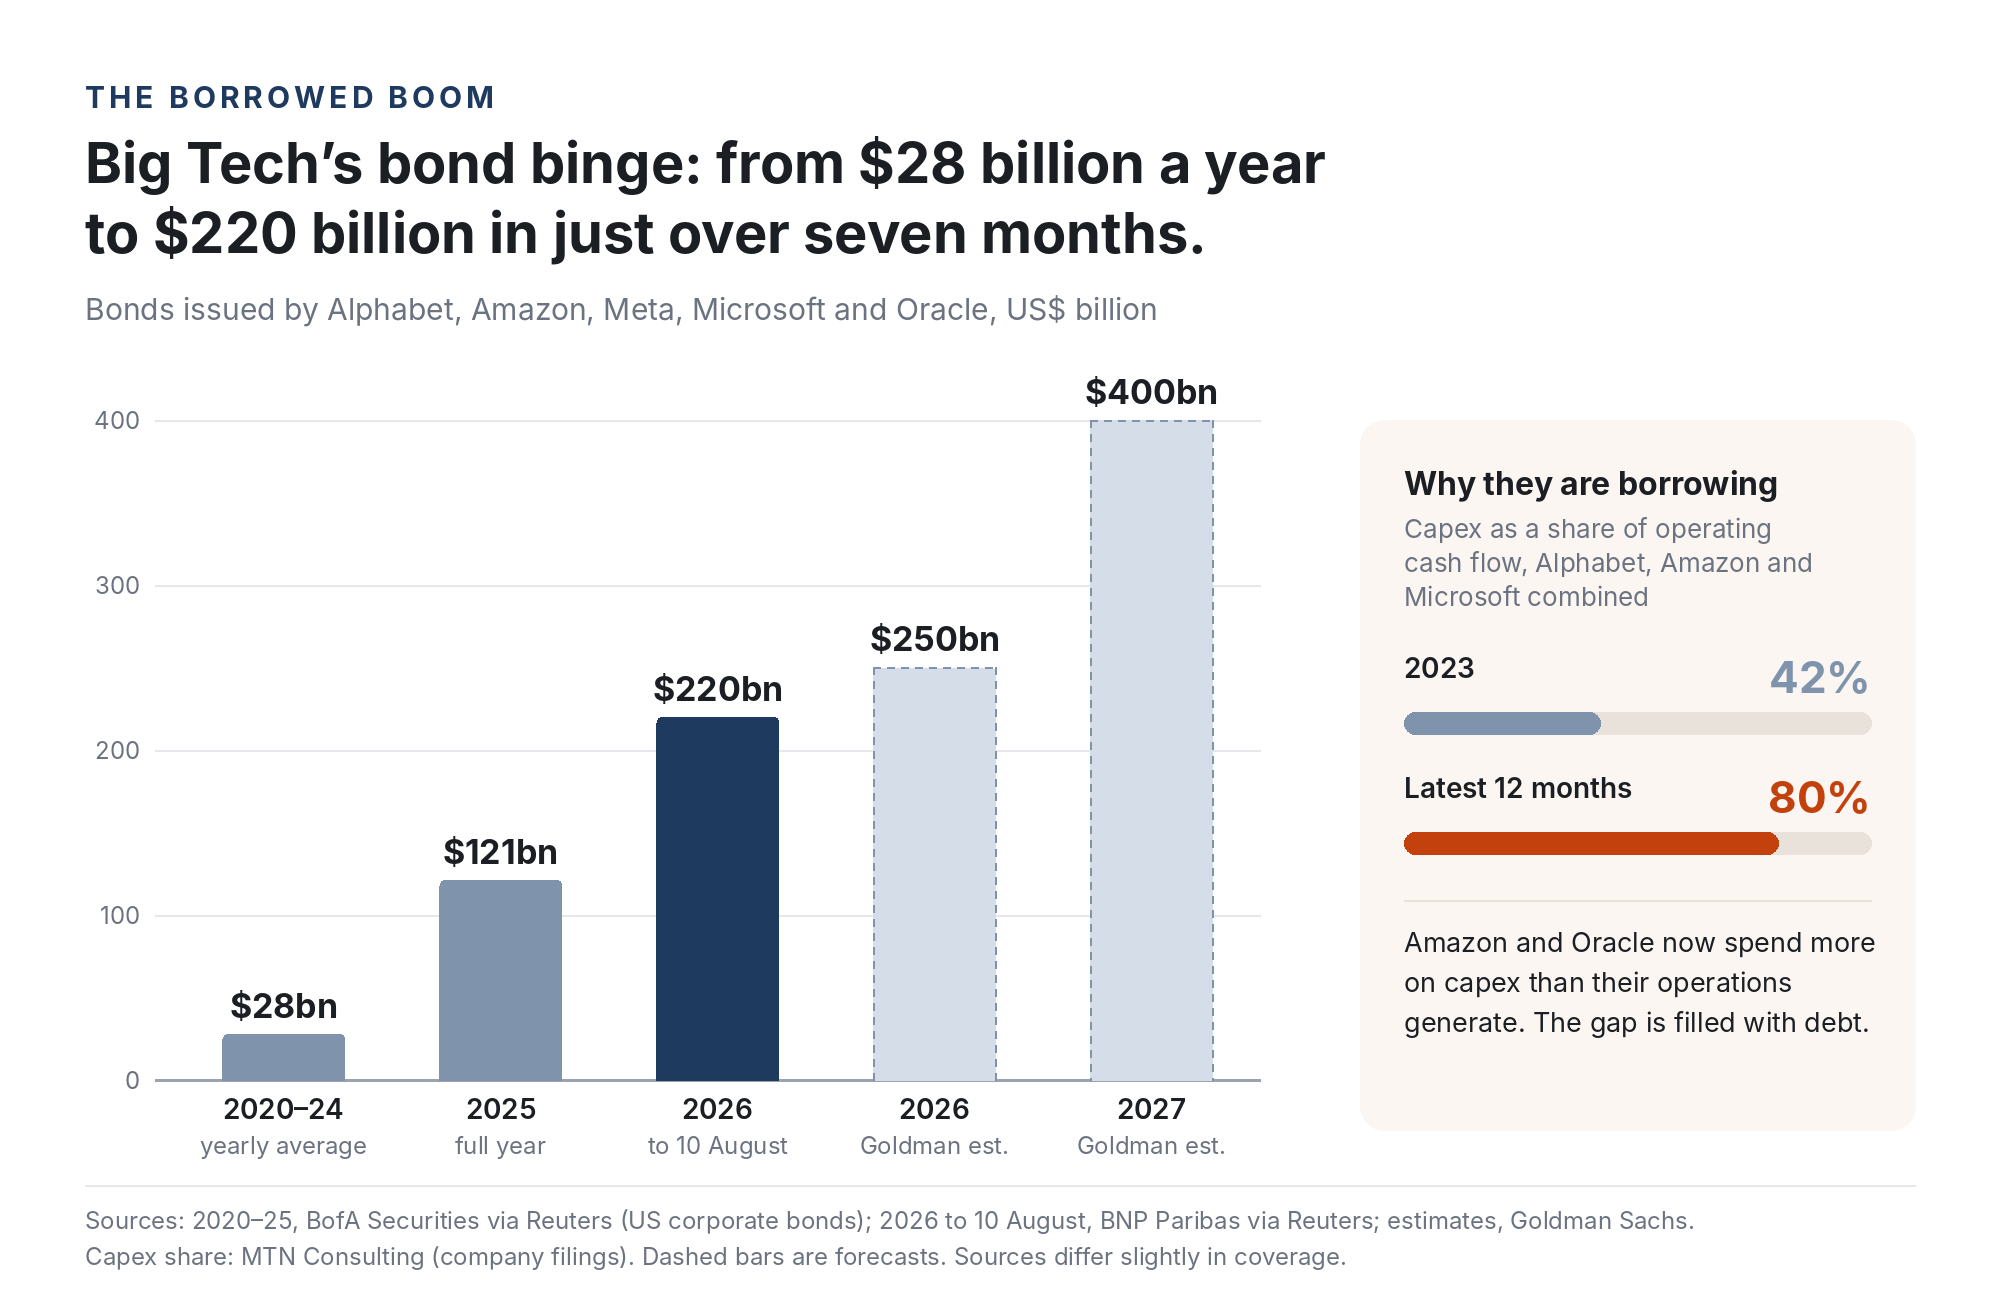
Chart sources: BofA via Reuters • BNP Paribas via MarketReview • Goldman Sachs via Reuters • MTN Consulting • Fortune (100-year bond)
- Lenders are getting choosy. S&P cut Oracle to BBB- in July, one notch above junk, and about half its $664 billion order book is reportedly tied to OpenAI. New tech bonds now pay about 12 basis points over existing debt, up from about 2 in 2025.
- Why India feels it. This debt competes with Treasuries for the same pension money, adding to pressure on long-term yields. The US 10-year closed at 5.31% on 5 October, a 24-year high. India’s 10-year now pays just 1.94 points more, half its 10-year average.

THE BOTTOM LINE
Global capital now has a safe 5% in US bonds and a growth story in AI. India has to compete with both.
THE TOLL BOOTH
Why foreign investors keep less of what India earns
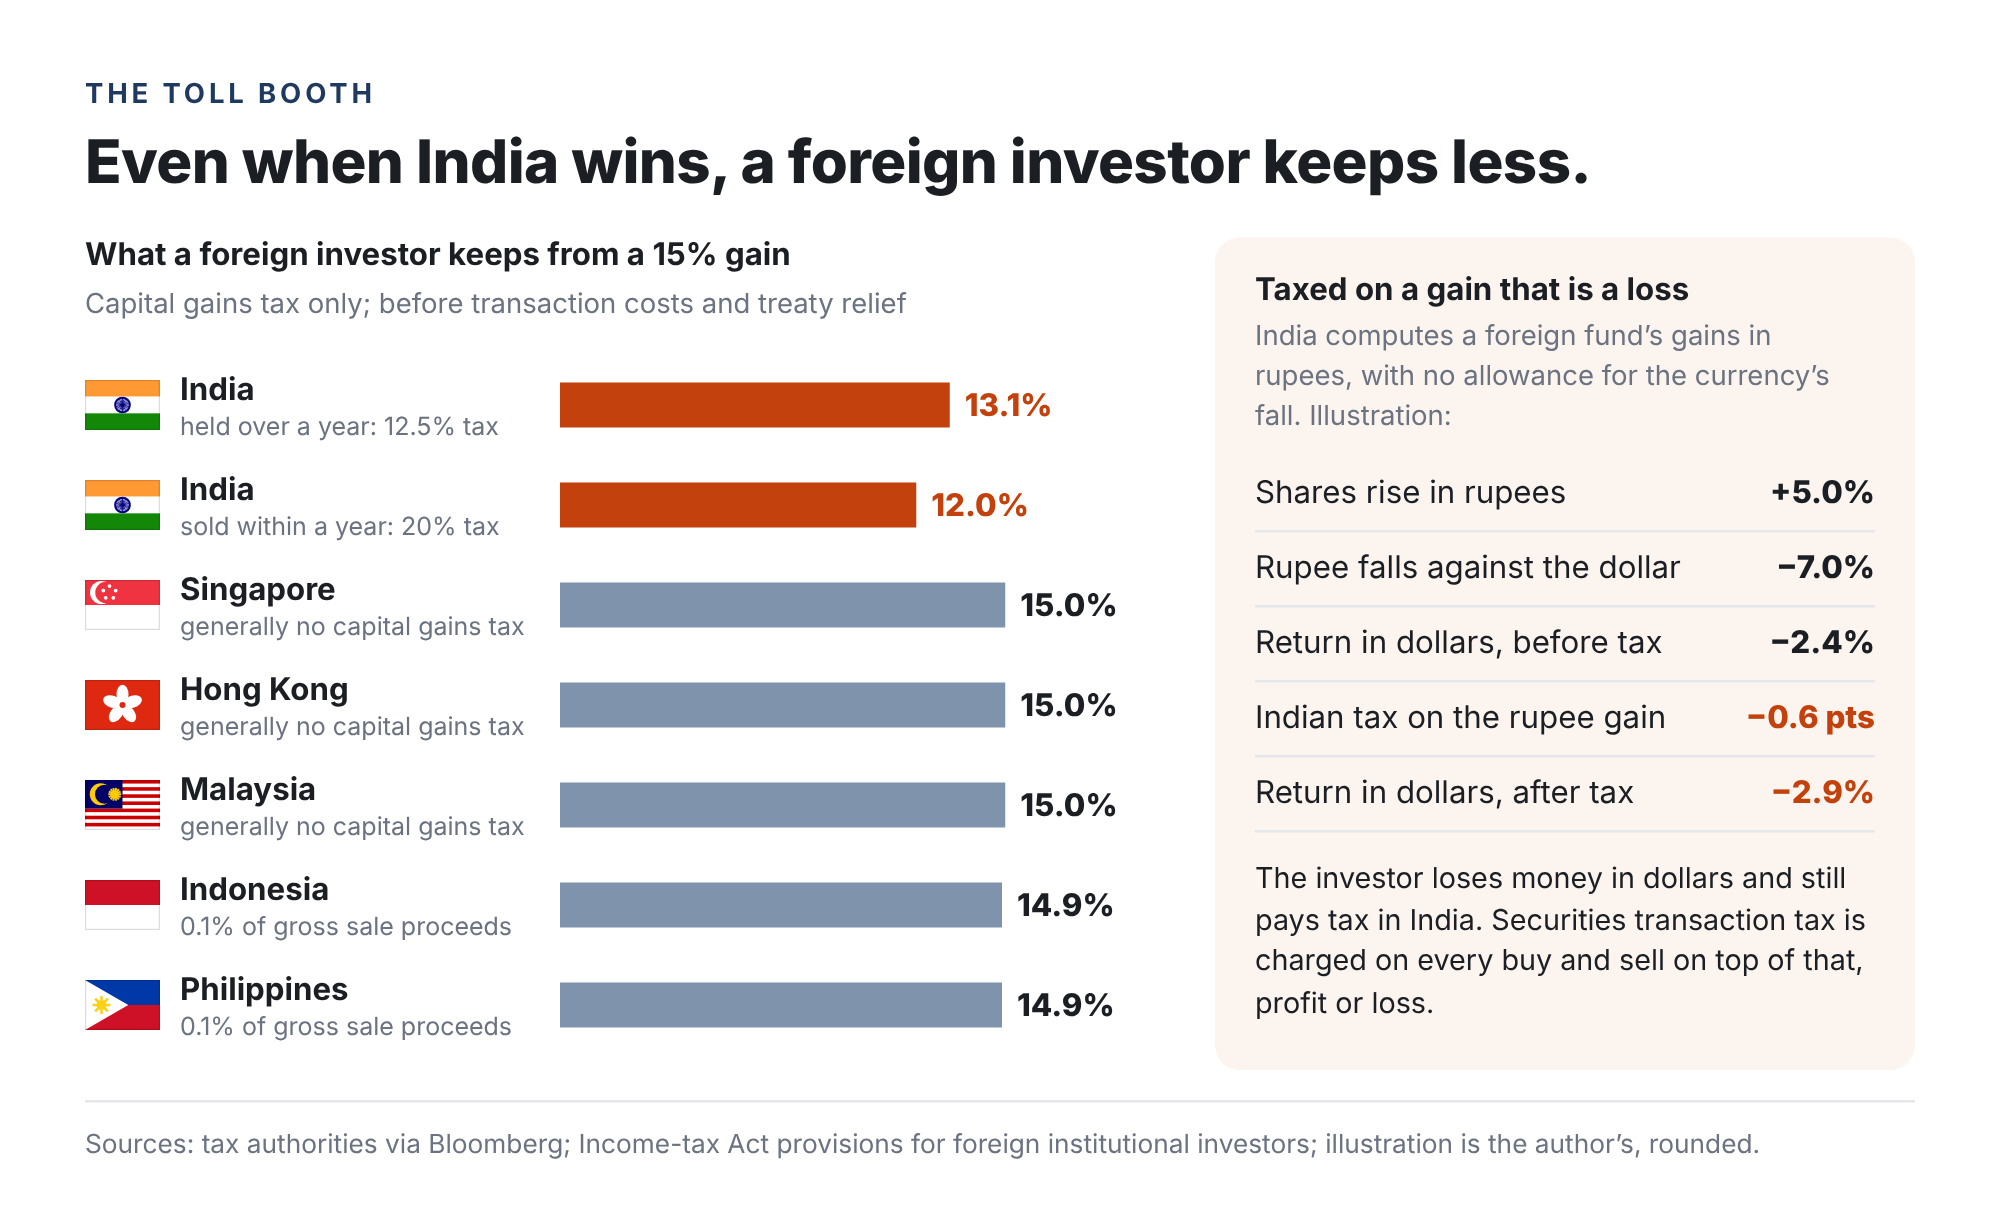
Chart sources: Income Tax Department (Section 115AD) • PwC Philippines (CMEPA)
- Higher rates. India taxes foreign investors’ gains on listed shares at 12.5% after a year and 20% before. Singapore, Hong Kong and Malaysia generally charge nothing; Indonesia and the Philippines levy 0.1% of sale value.
- Tax on phantom gains. Gains are computed in rupees, so an investor who loses money in dollars can still owe tax in India.
- A levy on every trade. STT arrived in 2004 as a substitute for long-term gains tax. The gains tax returned in 2018; STT stayed. Derivative rates rose again in April, and collections are up 53% this financial year.
THE BOTTOM LINE
In a falling market, a foreign investor in India can lose on the price, lose on the rupee, and still pay the exchequer.
So why hasn’t a record exit become a crash? Three buffers have absorbed the blow.
THE BUFFERS: WHAT HAS KEPT A SELL-OFF FROM BECOMING A ROUT
BUFFER ONE: HOUSEHOLD SAVINGS
The floor that is also a ceiling
- The counterparty. Domestic institutions bought a net ₹5.13 lakh crore by 7 August, as foreign ownership fell to 15.1%, a 69-quarter low.
- The quieter exit. Foreign direct investors took out $53.6 billion in FY26, leaving net FDI at $7.7 billion. Nearly three-quarters of this year’s record $12.5 billion of IPO money went to sellers, not companies.
- The paradox. Steady local buying keeps prices too high to tempt outsiders. India trades at nearly twice the region’s multiple, and BofA says markets are “still not in a value zone”.
- The strain. In April, more SIPs closed than started. Flexi-cap SIPs have returned 7.8% a year over three years.
BUFFER TWO: THE RBI’S RESERVES
Stability, bought week by week
- The drawdown. Reserves fell from $785.7 billion on 4 September to $734.6 billion on 2 October, about $51 billion in four weeks, mostly in foreign currency assets.
- The cost. The RBI has raised its policy rate to 5.50%, its first hike since February 2023, and opened a dollar window for oil companies. Each step buys time; none reverses the flows.
- The perspective. Reserves are still higher than a year ago. But this cushion is being spent, not built.
BUFFER THREE: EXPORTED SKILLS
The one AI is aimed at
- What pays the bills. In April–June, net services exports of $51.6 billion and net transfers, mostly remittances, of $40.8 billion covered almost all of an $86.1 billion goods deficit. Software services earned $221.4 billion in FY26.
- The exposure. Coding, testing, support desks and document processing earn India its dollars. They are exactly what AI is built to automate.
- The early signals. Top-five IT headcount fell by 7,389 in FY26. TCS grew 11.2% in rupees but only 2.8% in constant currency. Work moving to multinationals’ 2,117 in-house centres still earns dollars, but the profits go abroad.
THE BOTTOM LINE
India’s exposure to AI isn’t mainly in its stock market. It is in its balance of payments.
THE ROAD AHEAD: REFUGE, REFORM AND THE SIGNALS TO WATCH
CASUALTY OR REFUGE?
The hedge argument, stress-tested
- The case. If AI disappoints, US Big Tech, its bonds and its Asian suppliers would unwind together, while India’s growth is largely domestic. In 2022, when the Nasdaq fell over 30% and MSCI Emerging Markets 22.3%, the Nifty rose 4.3%.
- The record so far. Last December, funds including Aberdeen, Eastspring and Jefferies told Bloomberg India was a top hedge against an AI correction. Ten months on, that hedge has cost its holders. Insurance pays only if the insured event occurs.
- The caveats. In 2022, the rupee fell about 10%, so dollar investors still lost. A sharp unwind hits every risky asset first; the Nifty fell 38% in two months in 2020. And Korea’s slide shows that money leaving AI does not automatically come to India.
THE BOTTOM LINE
India becomes a refuge only if its buffers are still intact when the boom turns.
THE POLICY LEVERS
What would make India worth the trip again
In June, the government made foreign investors’ income from government bonds tax-free, backdated to April. Equities were left out. Four levers would extend that logic, each at a fiscal cost:

WHAT TO WATCH
Seven signals, in order of urgency
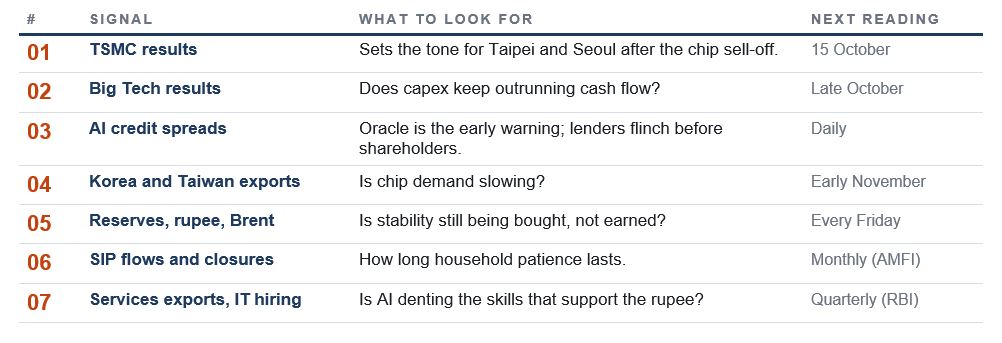
In my last piece, I wrote that a cheaper Nifty opens the door, and earnings will decide when global capital walks back through it. The AI cycle has added a second clock. Weekly reserves, monthly SIP flows and the quarterly balance of payments will answer a question that matters more for India than whether AI is a bubble:
Who blinks first: the boom, or the buffers?
Disclaimer: Views expressed are personal. This article is for information only and is not investment advice. Readers should consult a SEBI-registered adviser before investing.
SOURCES
Markets: Kotak Neo | Business Standard (8 Oct) | Business Standard (Jan record) | Paytm Money | ThePrint | Korea JoongAng Daily | Korea Times | Herald Business | Taipei Times | Taiwan Stock Exchange | TheStreet | BofA via Business Today | Business Standard (folios).
Index composition and flows: MSCI Taiwan | MSCI Korea | MSCI USA | MSCI India | NSE Indices | Focus Taiwan | EE Times Asia | Seoul Economic Daily | Schwab Asset Management | State Street | Moneycontrol | NSDL | Free Press Journal | Bloomberg.
Earnings and exports: Yonhap | Focus Taiwan | DBS via Business Today | SK hynix | Samsung | TSMC | TCS | HCLTech | Infosys | Wipro | Federal Reserve G.5.
Borrowing and yields: Reuters (BofA) | MarketReview | Reuters (spreads) | MTN Consulting | FactSet | Fortune | Computing | MarketWise | TwentyFour | FRED | CNBC | Business Standard.
Tax: Income Tax Department | PwC Philippines | Angel One | The Week.
Buffers: Free Press Journal | NSE Ownership Report | Outlook Business | Telangana Today (LSEG) | Tribune (BofA) | INDmoney (AMFI) | Business Today (Vivek Kaul) | Trading Economics | Times of Oman | RBI | IBEF | IANS | Nasscom-Zinnov.
Outlook: Bloomberg via Business Standard | Business Standard (2022).
Market data as of 13 October 2026 unless stated. Year-to-date returns are the author’s calculations from index closes.