
Shares of oil marketing and refining companies, including Reliance Industries and Oil and Natural Gas Corporation (ONGC), traded with volatility in intraday deals on the BSE on Monday, January 5, following the US attack on Venezuela.
Reliance share price hit an all-time high of ₹1,611.20 but dropped over 1% from its peak to hit an intraday low of ₹1,588.70. On the other hand, ONGC’s share price dropped over 2% to an intraday low of ₹235.75 after rising over 2% to an intraday high of ₹246.55.
The BSE Oil and Gas index declined by 1% during the session, a day after rising by almost 1%.
Reliance and ONGC shares, along with most other oil stocks, fell during Monday’s session after a US military strike against Venezuela on Saturday, raising concerns that the geopolitical conflict could disrupt the oil market, as the Latin American country reportedly holds the largest known oil reserves.
While crude oil prices traded lower on Monday, there are concerns that a prolonged US-Venezuela conflict could escalate into a larger geopolitical crisis, potentially driving up crude oil prices and straining the margins of oil refiners.
The US-Venezuela saga: What it means for Reliance, ONGC?
Experts say that while tensions between the US and Venezuela have reintroduced a risk premium into global oil markets, their impact on Reliance Industries and ONGC may differ.
According to Seema Srivastava, Senior Research Analyst at SMC Global Securities, for ONGC, the impact is relatively straightforward.
“Higher and more volatile Brent prices directly enhance upstream realisations, supporting revenue, EBITDA, and cash flows across its domestic and overseas production portfolio. ONGC’s earnings visibility improves as crude firms, with volumes largely unaffected,” said Srivastava.
“While risks of government intervention-such as fuel price controls or windfall taxes-remain if crude spikes sharply, the current policy stance appears balanced. As a result, ONGC offers investors direct leverage to sustained oil strength, positioning it as a tactical beneficiary of geopolitical disruptions in supply,” said Srivastava.
For Reliance, Srivastava said the impact could be more nuanced.
Srivastava highlighted that elevated crude prices can be neutral to mildly negative for standalone refining margins if driven purely by supply-side risk, as feedstock costs rise. However, Srivastava underscored that US-Venezuela tensions typically widen heavy sour crude differentials, which favour complex refiners like Reliance that can process discounted grades and optimise crude slates.
Moreover, any disruption in Venezuelan exports could tighten global product balances, supporting refining and marketing margins, particularly for middle distillates such as diesel and jet fuel, said Srivastava.
Reliance can’t be seen just as an oil player as its valuation trajectory is increasingly anchored by its consumer businesses-Jio and Retail-which remain insulated from crude volatility.
“From a portfolio perspective, ONGC provides more direct upside to geopolitical crude strength, making it a tactical play on sustained oil firmness. Reliance, by contrast, offers resilience: near-term cyclicality in its O2C segment is offset by structural growth in digital and retail, with selective upside from refining complexity rather than outright oil price appreciation,” said Srivastava.
“Together, the two stocks present complementary exposures-ONGC as a pure crude lever, Reliance as a diversified growth story-allowing investors to balance tactical energy upside with long-term stability,” Srivastava said.
Reliance shares: What tech charts indicate?
According to Jigar S. Patel, Senior Manager of Equity Technical Research at Anand Rathi Share and Stock Brokers, Reliance is showing steady bullish traction at the current juncture, having taken support near the rising trendline and sustaining above all major DEMA clusters on the daily chart, which reflects a strong underlying price structure.
Patel highlighted that on the broader timeframe, a visible cup-and-handle breakout on the monthly chart signals the possibility of a sustained upside continuation, as such formations typically follow a consolidation phase before expansion.
“From an indicator standpoint, ADX holding above 20 highlights improving trend strength, while RSI sustaining above 60 indicates positive momentum and continued buying interest. Based on this setup, traders may look for a potential upside target of ₹1,680, while maintaining a stop loss at ₹1,510 on a daily-close basis, with accumulation preferred on dips,” said Patel.
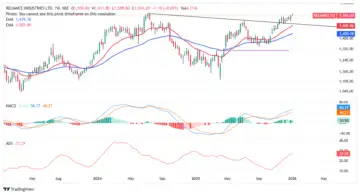
Aakash Shah, a research analyst at Choice Broking, said Reliance shares have successfully broken above the previous resistance zone near ₹1,580-1,585, indicating a clear continuation of the uptrend. Price structure remains very positive with higher highs and higher lows, reflecting sustained buying interest.
Shah highlighted that the stock is trading comfortably above all key EMAs, which are well aligned and sloping upwards – a classic sign of trend strength. The 20-day EMA around 1,560 is acting as immediate support on any minor pullback.
Shah further said that momentum indicators remain supportive, with RSI around 65, showing strong bullish momentum without entering the overbought zone. Volumes are steady, suggesting healthy participation at higher levels.
“On the downside, ₹1,555 acts as a crucial stop-loss level, while on the upside, the stock has the potential to move towards ₹1,700 in the near term, as long as it sustains above support,” said Shah.
ONGC shares: What tech charts indicate?
According to Patel, at the current juncture, ONGC has witnessed selling pressure from the day’s high and is presently trading just above the weekly pivot support at 235. This indicates some hesitation at higher levels.
“For the next two sessions, a sustained close above 242 will be crucial to confirm upside continuation and revive bullish momentum. Until such a confirmation is seen, the prudent approach would be to maintain a wait-and-watch stance,” said Patel.
“On the downside, ₹235 remains the immediate short-term support, and a breach of this level could invite further weakness. On the upside, ₹245 is placed as the near-term resistance, where supply is likely to emerge. Overall, directional clarity will depend on price behaviour around the ₹242-245 zone,” said Patel.
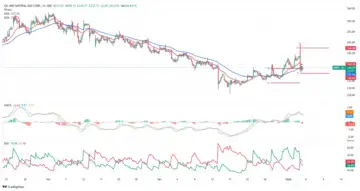
Hitesh Tailor, a technical research analyst at Choice Broking, said on the weekly timeframe, ONGC has taken strong support near the 200-week EMA, from where a meaningful reversal is visible, supported by healthy volumes. This confluence highlights long-term buying interest emerging at lower levels despite near-term consolidation.
From a momentum perspective, Tailor said that the stock is hovering around key moving averages and continues to trade within a defined range. The RSI, which earlier slipped into the oversold zone, has now shown a clear reversal and is gradually moving higher, indicating improving momentum and a potential base formation.
However, the absence of a decisive breakout suggests that the upside remains capped in the near term, said Tailor.
“For long-term investors, accumulation is evident in the ₹210-220 zone, making it a favourable buy-on-dips area with a long-term perspective and disciplined risk management. On the upside, strong resistance is placed around ₹260-280. Short-term traders are advised to wait for a clear structural shift with a range breakout above resistance, supported by strong volumes, before initiating fresh long positions,” said Tailor.