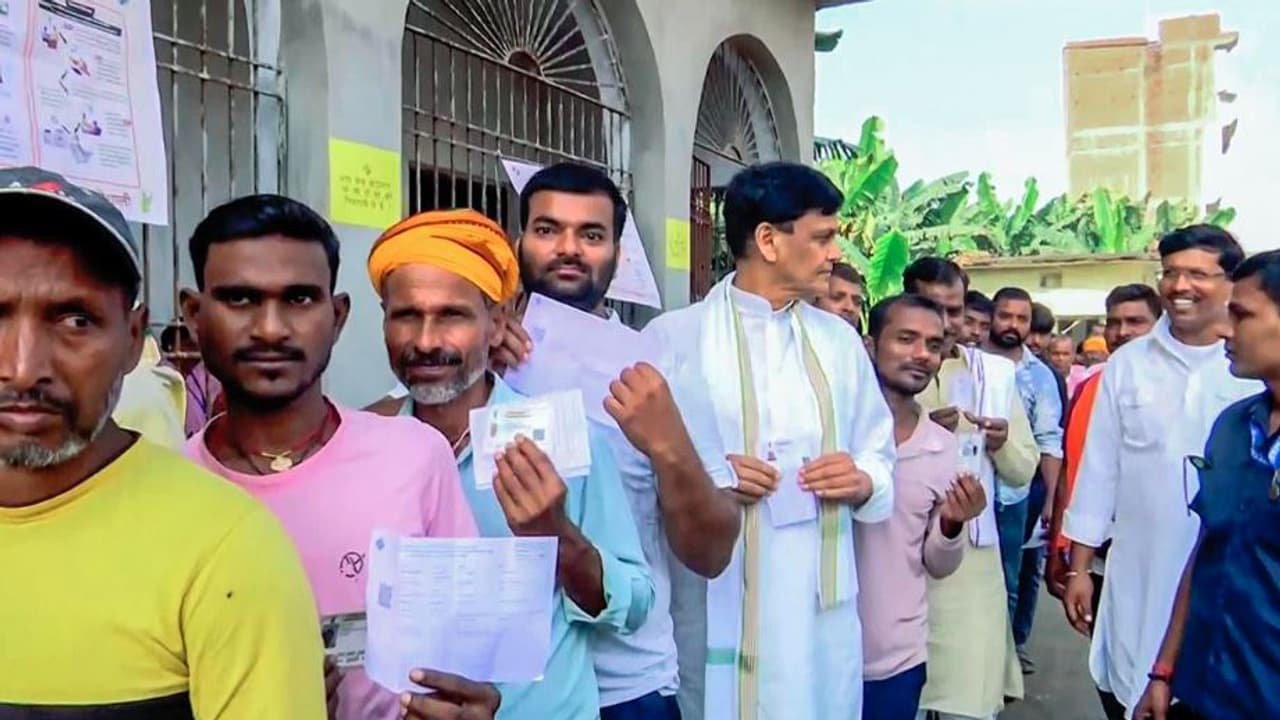
The journey of voting percentage in Bihar reflects political changes. It increased from 40–50% in the early 1990s to 62%. After the 2005 decline, a new record was set in 2025 with 64.66%.
Bihar Election 2025: Since independence, the journey of voter turnout in Bihar assembly elections has been a mirror of the state’s growing political awareness and social changes. Voting trends can be divided into three major phases, reflecting the level of voter participation and enthusiasm.
Early indifference and steady involvement (1951 – 1977)
Voting percentage remained relatively low and stable in the first two decades of independence.
- Low start (around 40%): In the first three elections (1951–52, 1957, 1962), participation hovered between 42% and 44%. This reflected low participation, lack of literacy, lack of awareness in rural areas and the influence of traditional social structures.
- Early Breakthrough of 50%: In 1967, turnout crossed 50% for the first time (51.51%), indicating increasing polarization in state politics and political participation of new social classes. This figure remained between 50% and 53% until the 1970s.
‘Grand-Partnership’ of the Mandal-Kamandal era (1980 – 2000)
There was a major change in the politics of Bihar in the late 1980s and 1990s. The rise of social justice politics and increased mobilization of OBC/Dalit communities took electoral participation to historic highs.
- Record surge of 60%: Voting percentage directly reached 62.04% in the 1990 elections. This was a turning point in the democratic history of Bihar, which showed that the deprived and backward classes had now become the decisive force.
- Stable high participation: This enthusiasm continued in 1995 (61.79%) and 2000 (62.57%). The 2000 figure of 62.57% remains the state’s highest voter turnout until 2025.
Unexpected decline and modern renaissance (2005 – 2025)
The early 21st century saw an unexpected decline and then a steady increase in voting patterns.
- Big decline in 2005: Political instability led to two assembly elections in 2005, and in both the voter turnout dropped dramatically to around 46%. This may be a result of voter disappointment or political uncertainty.
- New participation (50% to 60%): Since 2010, there has been an increased emphasis on governance and development in the state, which has led to an increase in participation again. Voting was 56.91% in 2015 and 57.29% in 2020. This phase saw a significant increase in participation of women voters.
Historic Record of 2025: The record-breaking participation of 64.66% in the first phase of Assembly Elections 2025 broke all records in the 74-year democratic history of the state, reflecting the highest activism and awareness of the voters of modern Bihar.
when and how much voting took place
1951-52: 42.60%
1957: 43.24%
1962: 44.47%
1967: 51.51%
1969: 52.79%
1972: 52.79%
1977: 50.51%
1980: 57.28%
1985: 56.27%
1990: 62.04%
1995: 61.79%
2000: 62.57%
2005 (February): 46.51%
2005 (October): 45.85%
2010: 52.73%
2015: 56.91%
2020: 57.29%
2025 (1st phase): 64.66%
