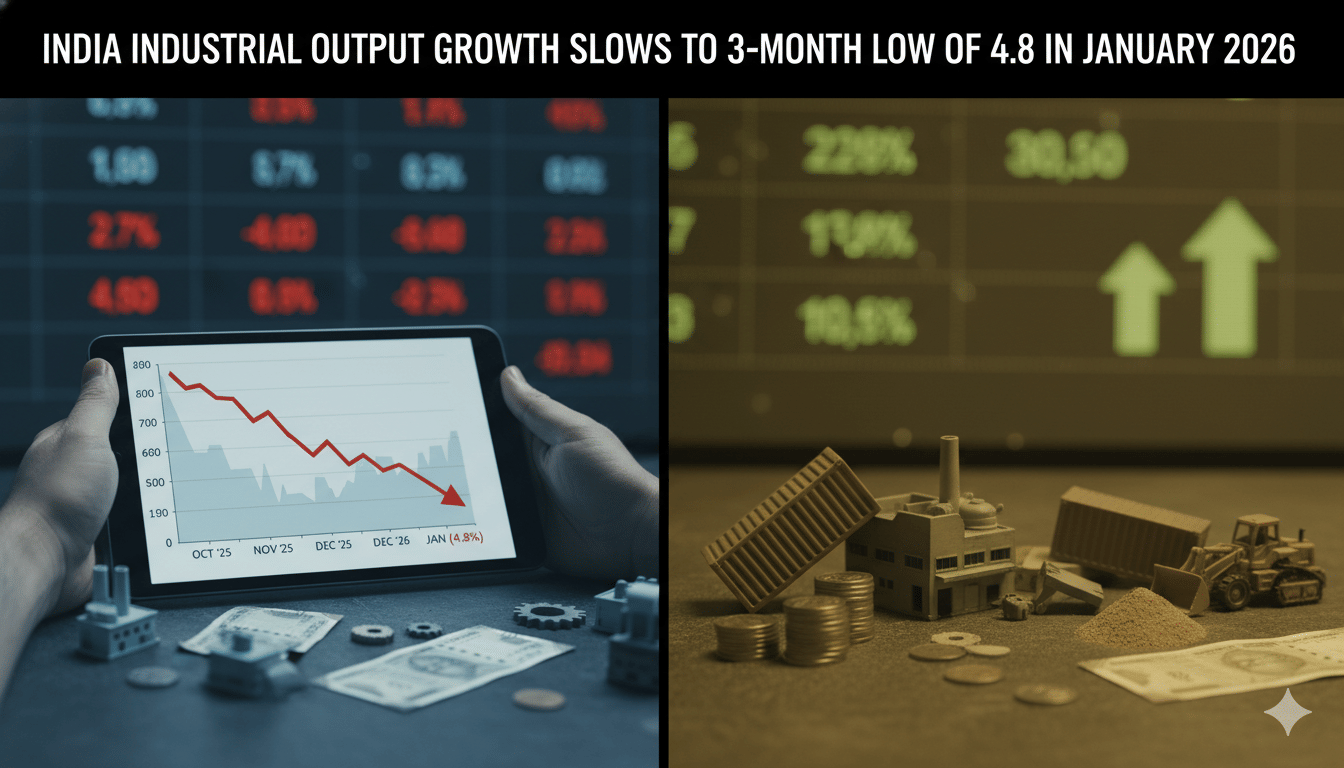
New Delhi: India’s industrial production growth recorded a decline to a three-month low of 4.8 per cent in January. The deceleration was a result of subdued performance in the manufacturing and mining sectors, the official data released mentioned on Monday.
India’s factory output, measured in terms of the Index of Industrial Production (IIP), expanded by 5.2 per cent in January 2025. The National Statistics Office (NSO), which releases the data, revised the industrial production growth for December 2025 to 8 per cent from the provisional estimate of 7.8 per cent released in January 2026.
The NSO data showed that India’s manufacturing sector’s output growth decelerated to 4.8 per cent in January 2025, while it stood at 5.8 per cent in same month a year ago.
Mining production growth also slowed marginally to 4.3 per cent in January, while it was registered a growth of 4.4 per cent a year ago.
Power generation went up by 5.1 per cent in January 2025; it was 2.4 per cent expansion in the year-ago period.
“The Quick Estimates of IIP stands at 169.4 against 161.6 in January 2025. The Indices of Industrial Production for the Mining, Manufacturing and Electricity sectors for the month of January 2026 stand at 157.2, 167.2 and 212.1 respectively,” the official statement stated.
The manufacturing sector witnessed that 14 out of 23 industry groups recorded a positive growth in January 2026 over January 2025.
Top three positive contributors for January 2026
- Manufacture of basic metals (13.2 per cent)
- Manufacture of motor vehicles trailers and semi-trailers (10.9 per cent)
- Manufacture of other non-metallic mineral products (9.9 per cent)
INDEX OF INDUSTRIAL PRODUCTION – SECTORAL
(Base: 2011-12=100)
| Month | Mining | Manufacturing | Electricity | General | ||||
| 14.372472 | 77.63321 | 7.994318 | 100 | |||||
| 2024-25 | 2025-26 | 2024-25 | 2025-26 | 2024-25 | 2025-26 | 2024-25 | 2025-26 | |
| Apr | 130.9 | 130.7 | 144.6 | 149.1 | 212 | 215.7 | 148 | 151.8 |
| May | 136.5 | 136.4 | 150.4 | 155.2 | 229.3 | 218.5 | 154.7 | 157.6 |
| Jun | 134.9 | 123.2 | 146.6 | 152 | 222.8 | 220.1 | 151 | 153.3 |
| Jul | 116.1 | 107.7 | 148.8 | 157.7 | 220.2 | 228.4 | 149.8 | 156.2 |
| Aug | 107.1 | 114.2 | 146.1 | 151.6 | 212.3 | 221.1 | 145.8 | 151.8 |
| Sep | 111.7 | 111.2 | 147.2 | 155.4 | 206.9 | 213.4 | 146.9 | 153.7 |
| Oct | 128.5 | 126.2 | 148.4 | 151.3 | 207.8 | 193.4 | 150.3 | 151.1 |
| Nov | 133.8 | 141.6 | 147 | 159.5 | 184.1 | 181.3 | 148.1 | 158.7 |
| Dec | 143.2 | 153.1 | 157.2 | 170.4 | 192.8 | 204.9 | 158 | 170.7 |
| Jan* | 150.7 | 157.2 | 159.5 | 167.2 | 201.9 | 212.1 | 161.6 | 169.4 |
| Feb | 141.9 | 148.4 | 194 | 151.1 | ||||
| Mar | 158.1 | 162.4 | 219.5 | 166.3 | ||||
| Average | ||||||||
| Apr-Jan | 129.3 | 130.2 | 149.6 | 156.9 | 209 | 210.9 | 151.4 | 157.4 |
| Growth over the corresponding period of previous year | ||||||||
| Dec | 2.7 | 6.9 | 3.7 | 8.4 | 6.2 | 6.3 | 3.7 | 8 |
| Jan* | 4.4 | 4.3 | 5.8 | 4.8 | 2.4 | 5.1 | 5.2 | 4.8 |
| Apr-Jan | 3.4 | 0.7 | 4.3 | 4.9 | 5.1 | 0.9 | 4.2 | 4 |