The week ended March 28 proved to be a resounding success for bullish investors in the domestic markets, leading to a highly optimistic closure for the week, month, and the financial year.
Despite being truncated because of two national holidays, the Nifty index consistently traded in the positive territory across sessions. Throughout the last week, there were notable attempts by the benchmark to surpass the significant 22,500 mark, indicating a strong bullish sentiment in the market, although it ultimately closed below this threshold.
The last week, however, concluded with gains of over a percent, reflecting the positive momentum and sentiment among investors. Overall, it was a week marked by optimism and upward momentum, underscoring the resilience and confidence in the domestic markets.
Last week, our analysis centered around the crucial support of the 50-day exponential moving average (DEMA) for the Nifty index. Additionally, we delved into the bullish harmonic shark pattern and the morning star candlestick pattern. The impact of these technical indicators was evidently observed throughout the week, as they contributed to pulling the index back to the significant 22,500 mark.
However, a notable occurrence during the final hour of the preceding trading session led to a substantial pullback, driving the index towards the 22,300 mark, prompting a degree of scepticism in our outlook. Despite our prior bullish stance, we now anticipate fresh rounds of buying activity only if the index surpasses the 22,500 level or nears the 22,100 levels, owing to the emergence of negative divergence in the relative strength index (RSI) across multiple time frames. This divergence signifies a potential short-term reversal in momentum.
For the medium term, we maintain our optimistic outlook, asserting that as long as the support at 21,700 remains intact, the index retains the potential for further upward movement. Looking ahead, the short-term support level has been adjusted to 22,000 for the current week starting from April 1, underscoring the dynamic nature of market trends and the importance of vigilant analysis in navigating fluctuations.
Here are three buy calls for the next 2-3 weeks:
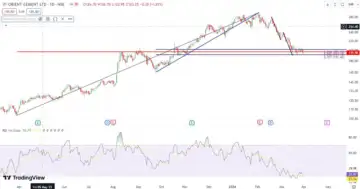
Orient Cement: Buy | LTP: Rs 196 | Stop-Loss: Rs 179 | Target: Rs 225 | Return: 15 percent
Following a peak near the Rs 293 level, Orient Cement encountered a notable downturn, marked by a sharp decline of 35 percent in its overall value. Despite this downturn, Orient Cement has shown signs of stabilisation around Rs 190 levels for the last week, establishing a sustained support base.
It’s noteworthy that the level of Rs 190 aligns with the Fibonacci ratio clustering, as indicated in the chart. Moreover, during this period, a 1:1 leg has also formed around this support zone, further reinforcing a bullish sentiment in the stock. An analysis of the daily scale RSI indicator reveals a bullish hidden divergence, suggesting a favourable outlook for Orient Cement.
Taking into account these factors along with chart patterns, investors may find it prudent to consider initiating buy positions within the range of Rs 190-198, with an upside objective of Rs 225. To manage the risks effectively, it’s advisable to set a stop-loss order at Rs 179 on a daily closing basis, providing protection against potential downside movements.

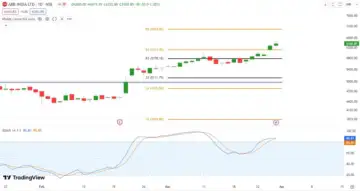
ABB India: Buy | LTP: Rs 6,361 | Stop-Loss: Rs 5,950 | Target: Rs 7,000 | Return: 10 percent
In the recent trading session, ABB India showed a significant breakout above the R4 camarilla pivot (Rs 6,111.4), maintaining its position above this level. Additionally, daily stochastics have ventured into the overbought territory, suggesting a bullish momentum anticipated in the upcoming days.
The combination of price action persisting above the R4 camarilla pivot and stochastics registering as overbought presents a compelling technical confluence, reinforcing the bullish sentiment surrounding ABB India.
Investors may consider initiating a ‘buy’ position within the range of Rs 6,250-6,400, targeting an upside potential of Rs 7,000, while prudently placing a stop-loss near Rs 5,950 based on the daily closing prices. 
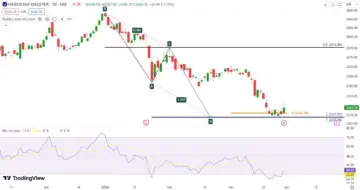
Hindustan Unilever: Buy | LTP: Rs 2,264 | Stop-Loss: Rs 2,145 | Target: Rs 2,500 | Return: 10 percent
Since reaching its peak around the Rs 2,669 mark on January 1, 2024, Hindustan Unilever has experienced a notable downturn, witnessing a significant decline of approximately 16 percent. However, in the subsequent six trading sessions, Hindustan Unilever has displayed resilience, avoiding further declines and instead consolidating within a range spanning from Rs 2,230 to Rs 2,280.
Notably, within this price range, a bullish AB=CD pattern has formed on the daily chart of Hindustan Unilever. This range also corresponds with the 0.50 percent retracement level of a price swing observed between March 2022 and July 2023, as depicted on the chart.
Additionally, on a daily scale, the RSI has exhibited a complex structure (W shape) along with some regular bull divergence on the 4-hour chart. Interestingly, the mentioned range of Rs 2,230-2,280 aligns with S5 Camarilla Pivot (Rs 2,243), suggesting a potentially attractive buying opportunity.
Therefore, it might be prudent to consider buying within the range of Rs 2,250-2,280, aiming for an upside target of Rs 2,500, while setting a stop-loss near Rs 2,145 on a daily closing basis. This comprehensive analysis highlights potential trading opportunities and risk management strategies for traders and investors considering positions in Hindustan Unilever.


