
What matters today
- Implied trading range: 22,700 to 24,000
- OI resistance: 24,000
- OI support: 23,000
- Structure: Rangebound
- Intraday tone: Sideways to bullish above 22,900
Open Interest- NIFTY50
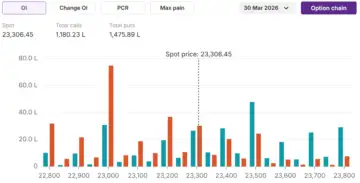
Positioning
| Trend | Wednesday | Tuesday |
|---|---|---|
| FIIs index short% (Futures) | 85% | 86% |
| PCR | 1.25 | 1.06 |
| OI (24,000 CE strike) | 77 lakh | 64 lakh |
Institutional intelligence
Foreign institutional investors (FIIs) extended their selling streak to the twentieth consecutive session, offloading equities worth ₹1,805 crore on 25 March. With this, their cumulative outflow for March has risen to ₹1,07,010 crore, marking the second-highest monthly sales figure in the past two years.
In index futures, FIIs marginally reduced their bearish exposure ahead of the April series rollovers. The long-to-short ratio eased to 15:85 on 25 March, indicating gradual short covering as expiry approaches.
That said, the broader positioning remains firmly bearish with a clear tilt towards short contracts. Traders should stay cautious, as the undertone continues to favour selling on rallies. Unless NIFTY50 reclaims the crucial 23,850 resistance zone, the index is likely to face pressure at higher levels.
Key levels for NIFTY50
- Expiry: March 30
- Resistance: 23,850
- Support: 22,450
- Call concentration: 24,000
- Put concentration: 23,000
- Bullish above: 23,850
- Bearish below: 22,450
Trend summary: 1-hour chart
- Price: Above 20 EMA and 50 EMA
- RSI: 58 (Neutral to bullish)
- ADX: 26 ( Trending)
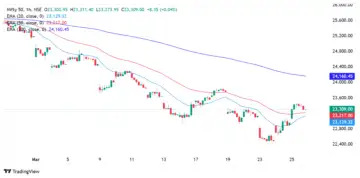
The NIFTY50 extended the gains on Wednesday by closing nearly 400 points higher. The index managed to hold the morning gains throughout the day and close near the intraday high levels, signalling strong buying on dips momentum on the index, amid positive global cues.
On the hourly charts, the index closed above the 20- and 50-EMA levels, suggesting sustained momentum. The RSI of 58 and the ADX of 26 suggest an overall bullish trend on the index in the short term.
If-then playbook
Scenario 1: NIFTY50 around 23,450 and 23,850
Following the bearish crossover between the 50 and 200 EMAs, the broader trend of NIFTY50 remains weak. The immediate resistance zones are placed at 23,450, 23,850, and 24,000. Any failure to sustain above these levels, particularly accompanied by bearish price action, could reinforce continuation of the bearish structure. However, a close above 23,450, will turn the structure rangebound.
Scenario 2: NIFTY50 below 22,450
The immediate support for NIFTY50 is placed around the 22,450 zone, in line with the March 23 low. With the index already correcting over 14% from its recent all-time high, the risk-reward for fresh shorts at current levels appears unfavourable, unless positions are initiated near key resistance zones. However, a decisive break below 22,450 would signal renewed weakness. It could open the door for a move towards 22,000, followed by the strong support zone around 21,700.
️ Market signals
GIFT NIFTY futures indicate a weak opening for NIFTY50 on Friday amid negative global market cues. Investors remained cautious on multiple conflicting reports on the Middle East.
The US markets closed sharply lower on Thursday after negotiation talks between the US and Iran failed to yield any results. The Dow Jones plunged 469 points, the S&P500 fell 114 points, and the NASDAQ tumbled the most by 521 points or 2.3%. However, the US stock market futures trade in green on Friday morning after President Trump delayed attacks on Iran’s energy infrastructure by 10-days.
The crude oil prices bounced back a little from the near-term lows as the situation on the ground remains weak despite rounds of negotiations taking place. The Brent crude oil prices hovered near the $100 per barrel mark on Friday morning, after jumping 2% on Thursday.
Growing scepticism around the negotiation talks between the US and Israel pulled the Asian markets lower. The Japanese and Hong Kong benchmark indices fell nearly 2%, while the Korean index plunged over 3% on Friday morning.