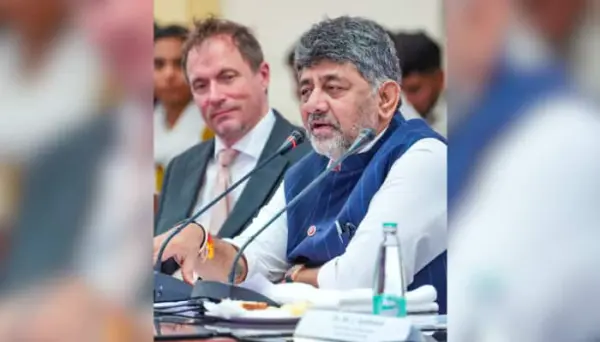
Karnataka Chief Minister DK Shivakumar on Sunday warned of a total ban on the sale of pan masalas and gutka if intoxicating substances are mixed and sold in pan masalas.
Addressing a massive audience at the 31st Foundation Day of the Rajiv Gandhi University of Health Sciences (RGUHS) and the Nasha Mukt Bharat (Drug-Free India) Conclave at Kanteerava Stadium, Karnataka Chief Minister said that the state is willing to absorb the financial hit. Even if a complete ban costs the state treasury roughly Rs100 crore in tax revenue, public safety and achieving a drug-free state take absolute priority.
In a major escalation against drugs, DK Shivakumar issued an absolute ultimatum to tobacco and chewable product manufacturers. The state government is prepared to enforce an outright blanket ban on all pan masala, gutka, and areca nut (supari) products if authorities discover any trace of illicit narcotic substances being mixed into them.
The Chief Minister revealed that the government has received disturbing intelligence reports indicating that certain manufacturers are intentionally lacing everyday tobacco items with intoxicating substances. The illicit strategy is reportedly designed to hook consumers by delivering a potent, drug-like “kick” disguised as a standard tobacco buzz.
“I have received information that even products like pan masala and gutka are now being mixed with substances that cause intoxication,” Shivakumar warned.
“If anyone is found adding even a small quantity of any intoxicating substance to these products, I will make every effort to see that they are banned in Karnataka.”
Highlighting the limits of purely local law enforcement, the Chief Minister utilised a “tap and bucket” analogy to explain the complex mechanics of interstate and international drug trafficking.
He pointed out that while Karnataka established a dedicated Anti-Narcotic Task Force (ANTF) to aggressively dismantle internal distribution loops, local efforts cannot achieve permanent success if national borders remain vulnerable.
“The drug menace in the country is like a tap and a bucket,” Shivakumar noted. “As long as the tap at the border stays open, no matter what you do locally, the bucket fills up repeatedly.” He stressed that a completely drug-free state requires impenetrable national border security alongside regional crackdowns.
He also delivered a sharp warning to the thousands of medical and paramedical students in attendance. DK Shivakumar made it clear that the state will exercise absolute zero tolerance for drug involvement under the Narcotic Drugs and Psychotropic Substances (NDPS) Act.
He explicitly warned that a single drug-related conviction would permanently derail a students medical career before it even begins: “A drug conviction under the NDPS Act can mean arrest, a permanent criminal record, and the end of a medical or professional career before it begins. No license, no registration, no practice. Do not trade a dream built over a decade for a single moment of recklessness. Be high on life, not on drugs, said CM Shivakumar.
The anti-drug conclave, which also featured prominent constitutional figures, including Vice President CP Radhakrishnan concluded with a collective pledge by over 25,000 students to act as primary ambassadors for the state’s clean-campus initiative.