
The cryptocurrency market endured one of its harshest crashes in months as Bitcoin dropped 17% on Saturday, tumbling from $122,500 to $101,500 within hours.
The sharp fall ignited a chain reaction of liquidations across leading exchanges, wiping out billions in leveraged positions. According to data shared by analyst , Bitcoin now faces a defining moment at its $108,000 support zone, which could dictate its next price direction.
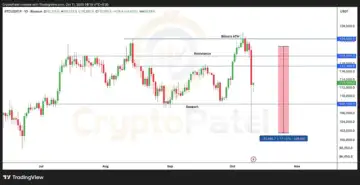 Patel’s chart placed Bitcoin’s all-time high near $124,545, with intermediate resistance at $119,979. The daily candle on TradingView formed a massive red bar, representing a $20,980 (-17.12%) loss, a clear signal of panic selling.
Patel cautioned that losing $108,000 could lead to “a bigger crash.” He wrote, “Strong support at $108,000. If it holds, we could see an upside move, but if it breaks, brace for a bigger crash.” At press time, Bitcoin was trading at $113,193 on Binance, showing a mild recovery but still under strain. Patel urged traders to stay vigilant, saying, “Stay alert; keep your positions in check.”
Widespread Liquidations Shake the Crypto Market
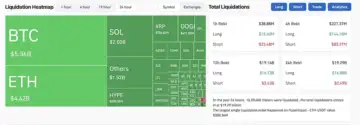
Data from CoinGlass revealed devastating losses across major cryptocurrencies. Over 1.65 million traders liquidated in the last 24 hours, resulting in a total loss of $19.29 billion.
Bitcoin accounted for the largest share, with $5.36 billion in liquidated funds, followed by Ethereum at $4.42 billion. Solana recorded $2 billion, and saw $706 million wiped out. Smaller altcoins, including DOGE, BNB, and ADA, also experienced significant downturns as leveraged long positions were liquidated.
 Derivatives Data Reveal Rising Trader Uncertainty
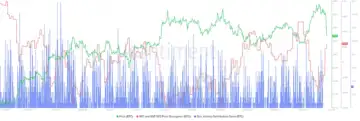
Bitcoin’s long/short ratio has been floating between bearish and bullish since mid-September, as reported by CoinGlass. The ratio was close to 1.0, indicating a fragile balance between buyers and sellers. The figure decreased to as low as 0.86, reflecting , but then it returned to equilibrium.
These swings indicate indecisiveness among traders during periods of high volatility. With changing positions in a very fast manner, there is still little trust in leveraged markets.
And might this delicate equilibrium give anticipations of a greater correction or a revival in the future?
Bitcoin Diverges from Stocks as Developer Activity Rises
New data from Santiment reveals a notable decoupling between Bitcoin and . From April 2025, Bitcoin’s price surged from $82,000 to $126,000 before falling back to $112,000, marking a 10.3% correction. Meanwhile, the BTC-S&P 500 divergence increased to 0.034, indicating that Bitcoin is moving independently of traditional markets.
 The activity of developers was also high during the same period. The count of Dev. Activity contributors were often over 15, particularly at times of price consolidations in July and August. The network stability was accompanied by every wave of increased developer participation, as traders responded to price movements.
At the beginning of October, Bitcoin held its position at approximately 109,000, and US equities faltered. Such a growing divergence suggested that on-chain innovation rather than macroeconomic dynamics drove Bitcoin. The information indicates that the more developers are involved, the can become as a result of technical advancements, rather than market forces.
Conclusion
Bitcoin’s 17% decline from $122,500 to $101,500 has sent shockwaves across the crypto market, triggering over $19 billion in liquidations. The key $108,000 support level remains the critical pivot that could determine Bitcoin’s next move.